Analyze OMERO data using a Jupyter Notebook
Description
We will demonstrate how to integrate CellProfiler and OMERO using the CellProfiler Python API and the OMERO Python API. We will use a Jupyter notebook to demonstrate the integration.
We will show:
- How to adjust an existing CellProfiler pipeline so that it can be used with OMERO.
- How load images from a Plate using the OMERO API.
- How to run CellProfiler using its Python API.
- How to plot the results.
- How to save the generated results back to OMERO as OMERO.table so they can be used later on by OMERO.parade.
Resources
We will use a CellProfiler example pipeline to analyse RNAi screening data from the Image Data Resource (IDR).
- Example pipeline from the CellProfiler website: Cell/particle counting and scoring the percentage of stained objects.
- Images from IDR idr0002.
- Notebook
idr0002_save.ipynb.
For convenience, the IDR data have been imported into the training OMERO.server. This is only because we cannot save results back to IDR which is a read-only OMERO.server.
Step-by-Step
The pipeline is run on all 2-Channel images from each Well in the 96-well plate (each Well contains one image), generating a CSV file containing rows for different objects identified in the image and columns for various parameters measured.
First, open the webclient and find the Plate belonging to trainer-1 named plate1_1_013.
Launch the idr0002_save.ipynb notebook in mybinder.org.
Select the first Step and click on the Run button to execute each step in turn.
For the connection to OMERO, you will be asked to enter your login details when running the OMERO credentials cell.
Select the plate in the webclient, find the Plate ID in the right-hand panel and copy this into the plate_id variable in the next step of the notebook.
The following cell loads the example pipeline and modifies it to remove the modules that are normally used for loading images from disk.
These modules are replaced by the InjectImage module, using numpy planes loaded from OMERO Images. This allows to pass data from OMERO to CellProfiler.
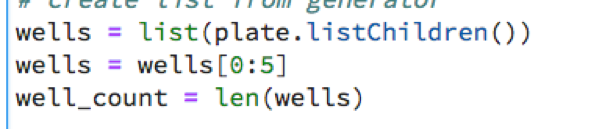
Note that to save time, we run on a subset of all Wells in the plate. We run it on the first 5 wells
The generated CSV file is read into a Dataframe for each image. We add the Image ID and Well ID, as well as the total number of Objects, Cell_Count, to each Dataframe.
All the Dataframes are then concatenated into a single Dataframe.
We visualize the data as histograms for each column with
df.hist().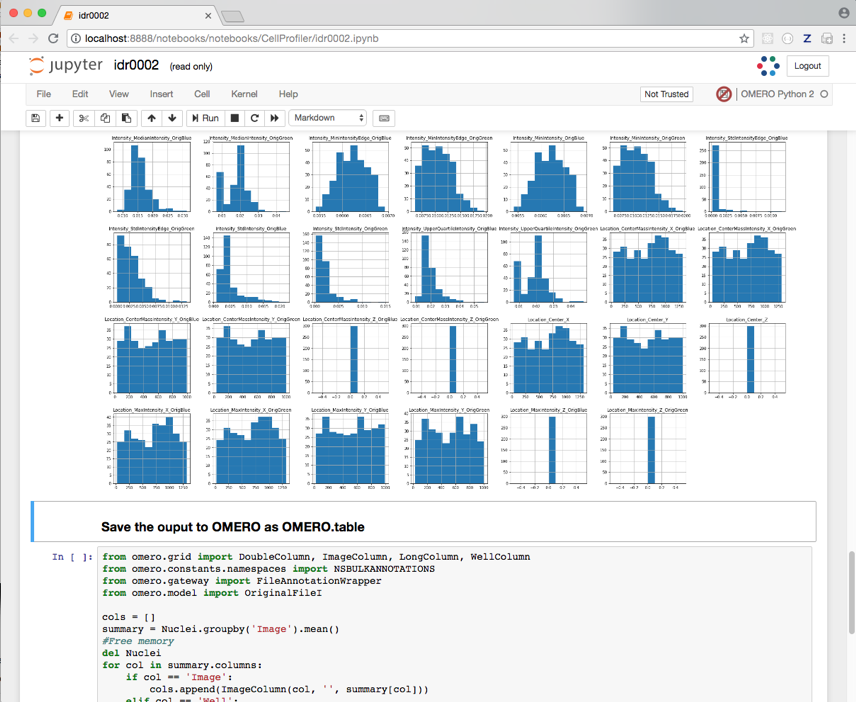
Finally, the Dataframe rows are grouped by Image to give an average value per Image of each parameter (column) in the table.
This data is saved back to OMERO as an HDF5-based table attached to the Plate, which can be read by other clients.
Return to the webclient and select the Plate named plate1_1_013_previously_analysed.
Select a Well in the central pane and open the Tables harmonica in the General tab in the right-hand pane. This will show all the CellProfiler values for this Well.
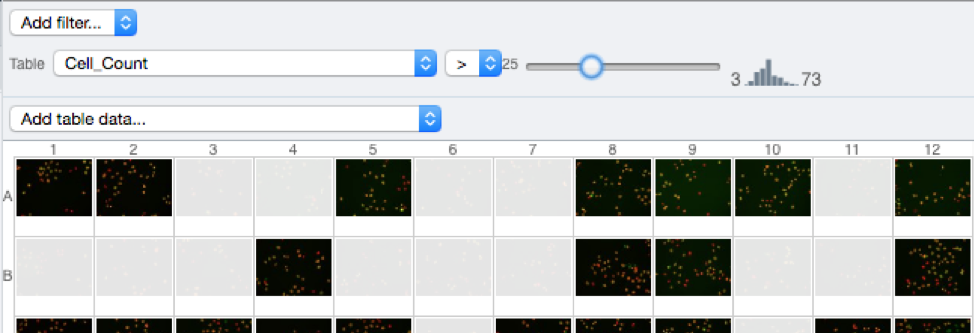
In the Thumbnails dropdown menu at the top-right of the centre panel, select the Parade plugin.
At the top-left of the centre panel choose Add filter… > Table to filter Wells by the data from CellProfiler.
Change the filter from ImageNumber to Cell_Count (at the bottom of the list).
Now you can use the slider to filter Wells by Cell Count.