Use ilastik as a Fiji plugin and OMERO
Description
In this section, we will show how to use the ilastik user interface to
perform segmentations on multi-z images stored in OMERO. The connection
between OMERO and ilastik is facilitated via Fiji, for which both OMERO
and ilastik have plugins. The segmentation steps in this part are
recorded and saved in the form of an ilp file in ilastik (ilastik
project). The ilp file is used later for the scripting workflow.
We will show:
How to manually open images from OMERO in ilastik using the Fiji plugin for OMERO and Fiji plugin for ilastik.
How to segment the multi-z images in ilastik and produce an ilastik Project (
ilpfile) recording the steps.How to save the results of the segmentation (ROIs and Probability maps) in OMERO, using the manual workflow and Fiji.
How to run a script in Fiji, consuming the
ilpfile and running the segmentation of the images coming from an OMERO Dataset, saving the ROIs on the original images in OMERO.How to manually classify images.
Setup
ilastik installation
ilastik has been installed on the local machine. See https://www.ilastik.org/ for details.
ilastik plugin for Fiji installation instructions
Start Fiji. Update it (
Help > Update ImageJ).In the
Manage Update Sitescheck the checkbox next to the “ilastik” site.After the update was successful, restart your Fiji.
The new ilastik menu item should be under Plugins menu.
Note: The ilastik menu item might be the last in the Plugins dropdown, not necessarily alphabetically ordered.
OMERO plugin for Fiji installation instructions
For installation instructions, go to Fiji installation.
Resources
Images from IDR idr0062.
Step-by-step
Manual training of z-stack segmentation in ilastik
Open Fiji, go to
Plugins > OMERO > Connectto OMERO and connect to OMERO.server provided using the credentials provided.Find the idr0062 Project, the Blastocysts Dataset, open the first image in Fiji.
After image has opened in Fiji, go to
Plugins > ilastik > Export HDF5. The ilastik menu item might be the last in the Plugins dropdown, not necessarily alphabetically ordered.Select a local directory to export to and save the image locally as an
.h5file.Repeat this step with several images from the Blastocysts Dataset of idr0062.
Start ilastik.
Click on
Pixel Classification.Save a new Project in ilastik.
Still in ilastik, open the image you saved as
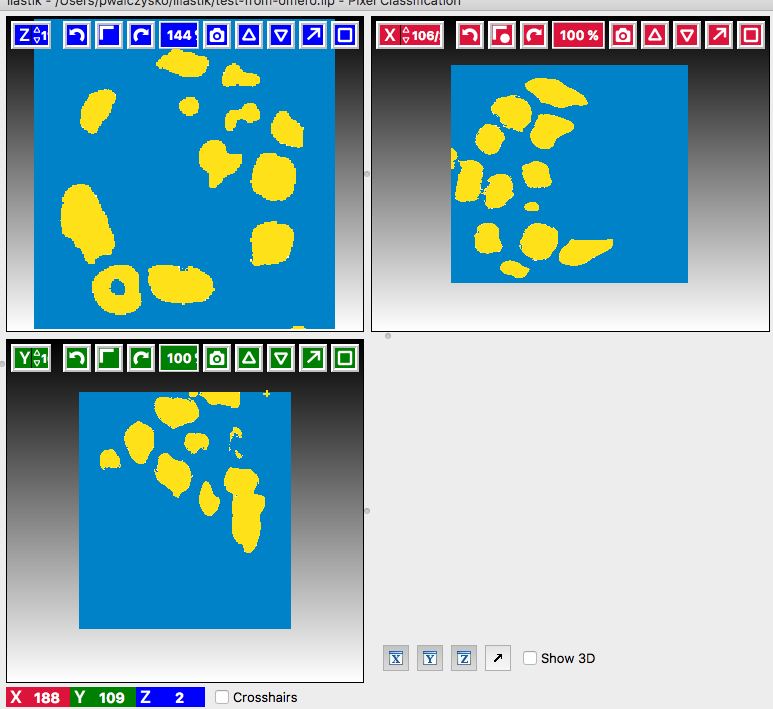
.h5in previous steps above (central pane,Add filebutton).Three views will open,
xy,xzandyz. You can explore the orthogonal views by clicking onto the checkbox in bottom right corner.In Left-hand pane, click
Feature Selection. Select all available features.You can explore the features at the bottom left corner, but this takes time.
Click on the
Trainingharmonica in the Left-hand pane.The training UI comes in left-hand pane with two labels already pre-defined by default.
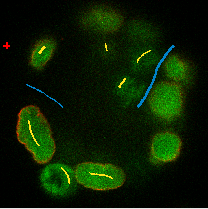
Select the first label, and by drawing LINES into the images, select a couple of cells in all three views.
 .
.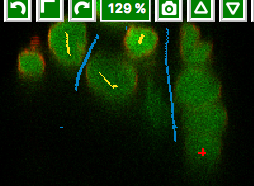
Select the second label, and again drawing lines, select some background (also select the narrow
channelsbetween two almost adjacent cells asbckgr(draw a line through them).Click on the
Live Updatebutton - this will take time, as the image has a large number of planes.Add new lines on cells which are too dim to be selected.
Click on
Live Update.... Repeat.Stop
Live UpdateClick on
Suggest Featuresbutton (to the left ofLive Previewbutton).A new UI window will open.
Click on
Run Feature Selectionin the left-hand pane of this new window. This will take time.Click on
Select Feature Setbutton in the bottom middle of the window.The
Suggest Featureswindow will close on this and you are back in the main ilastik window.Click
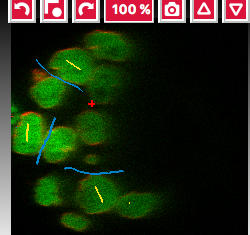
Live Updateagain.Toggle the images produced visible or not using the
eyeicons and the rendering settings of the particular images in the list in bottom-left corner. Below is an example of viewing theSegmentation Label 1andSegmentation Label 2layers viewable, the other layers (e.g.Raw data) are toggled invisible.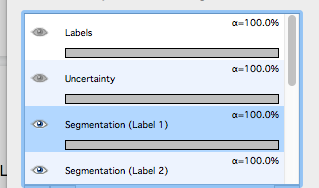
Add new lines if some segmentation still does not look right.
Click on the
Prediction Exportharmonica tab. In this tab, we will prepare the parameters of the exported images only, and will do the exporting itself later using theBatch processingharmonica.In the
Prediction Exportharmonica, select the features to be exported in theSourcedropdown menu in the left-hand pane. Export sequentiallyProbabilitiesandSimple Segmentationfor all three images you opened from OMERO via Fiji, using theBatch processingharmonica tab, see below.First, start with selecting
simple Segmentationin theChoose Export Image Settings, select theConvert to data Typeparameter to befloating 32 bit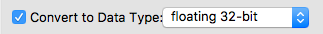 . The files will be exported into the folder where the original images were, unless you choose otherwise.By default, the export format is HDF5 (file extension
 .h5).Now, select in the left-hand pane the harmonica
Batch processing. In the centre top row of the view, click onSelect Raw Data Files.... Select all the three raw.h5files on your local machine, including the one you have just trained your pixel classification on.Click onto the
Process all data filesbutton in the left-hand pane.This will create three
.h5files in the folder you have chosen in theChoose Export Image Settingswindow (by default, these files will be placed in the folder where your raw data exports from OMERO are), the files will be named...Simple Segmentation.h5.Return to
Prediction Exportharmonica, select theProbabilitiesparameter in theSourcedropdown. Go to theBatch processingharmonica and click onto theProcess all data filesbutton in the left-hand pane. This will create another three.h5files in the local folder, named...Probabilities.h5.
Manual creation of ROIs in Fiji based on segmentations from ilastik and saving the ROIs to OMERO
Go to Fiji,
Plugins > Ilastik > Import...Browse to one of the “…_Simple Segmentation.h5” files which was created in ilastik in previous step and set the “Axis Order” to tzyxc (this might be the default for you). Do not check the checkbox
Apply LUT. ClickOK.The 3D image will open in Fiji. Select
Image > Adjust > Brightness and Contrast. Adjust themaxslider to the left, until you see the image grow grey (it is probably black just after opening).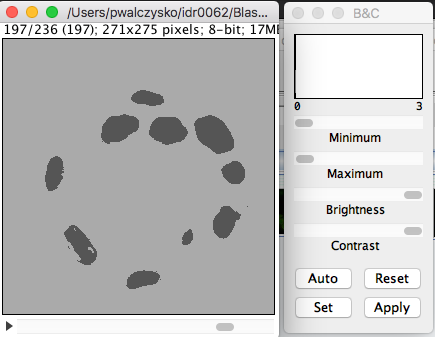
Note: Because in ilastik, the
Simple Segmentatioimages have the values of 2 where there is an object and 1 for Background, we need to invert the image for object analysis in Fiji. The object analysis (done by theAnalyze particlesplugin) is done in order to create ROIs which can be saved to OMERO.Select
Image > 8 bit. This will convert the values in the image into either 0 (cells) or 255 (background).Select
Edit > Invert. This is needed for the subsequentAnalyze particlesplugin - white objects on black background.Select
Analysis > Analyze Particles.Change the
Size(pixel^2)parameter to50-infinity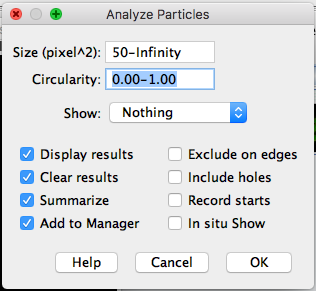
Click
OKand in the next dialog answerYes.Select
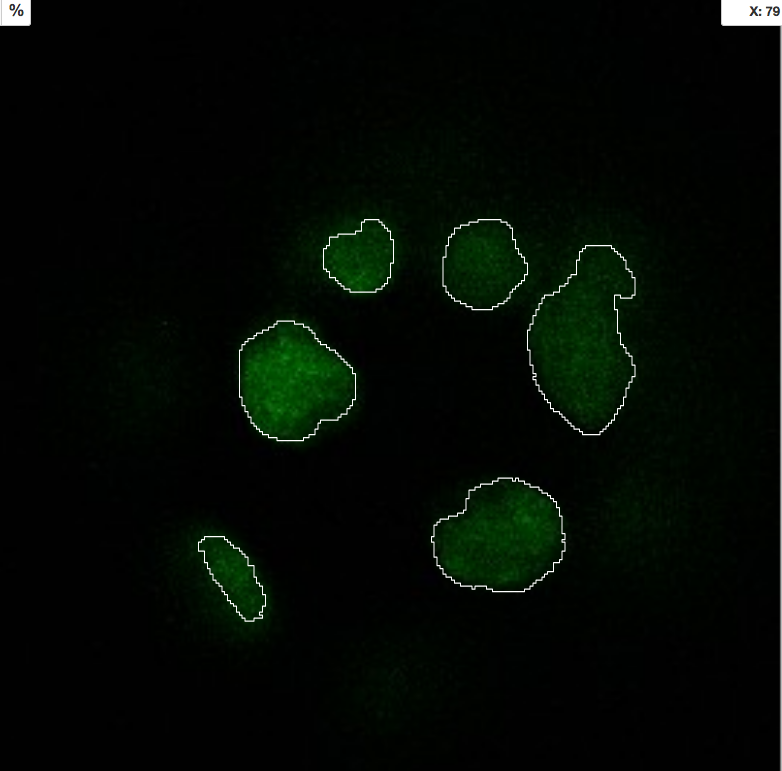
Plugins > OMERO > Save image(s)to OMERO. In the importer dialog, select the target Project and Dataset in OMERO or choose a new one.This will import the
Simple segmentationimage into OMERO with the ROIs from Fiji on it and the contents of the Results table will be attached to this new image.In order to have the ROIs from Fiji also on the original, raw image in OMERO.
Do not close the ROI Manager and the Results table.
Open the original raw image from OMERO into Fiji.
Click on the opened image.
Select
Plugins > OMERO > Save ROI(s)to OMERO (alternatively, you can re-run the analysis in Fiji by clicking onMeasurein the ROI manager of Fiji to produce a new Results table).In the new dialog, select a name for your results table which will be attached now to the original image.
Click
OK.ROIs and results will be now added to the original, raw image in OMERO
Repeat this workflow with the
...Probabilities.hfiles. Also, attach the ilastik project itself to the Dataset containing original data in OMERO.
Manual workflow of Object classification on z-stacks in ilastik
Start ilastik, choose the
Object classification with Prediction mapsoption and create a new Project and save it.Select in the
Raw datatab the raw image stored locally and in thePrediction mapstab the prediction map which you saved from thePixel classificationmodule for this image previously.Click on
Threshold and Size filterharmonica in the left-hand pane. This step discerns the objects form background by means of thresholding (note that the “Prediction maps” values are between 0 and 1, where 1 is 100% probability that the pixel is a cell, 0 is a 100% probability that the pixel is backgr.) The other parameter to specify the object except threshold in this tab is size of the object.Threshold is
0.5(if the probability of a pixel is higher than 0.5, then it is deemed to be a cell)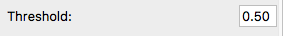
Change
Sizetominimum 50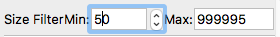 .
.Leave the rest of the parameters at default and click
Apply.A new image will be added to the stack at bottom left called
Final output. The objects are displayed on it in color coding. Again, you can toggle the images visible and change intensities in bottom left corner.Click on
Object Feature Selectionharmonica and click on the buttonSelect Features.In the new window, click on
All excl. Locationbutton to select almost all features.Click on the
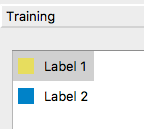
Label classesharmonica, click on the yellow label (Label 1) and select all the cells in all three orthogonal views images.
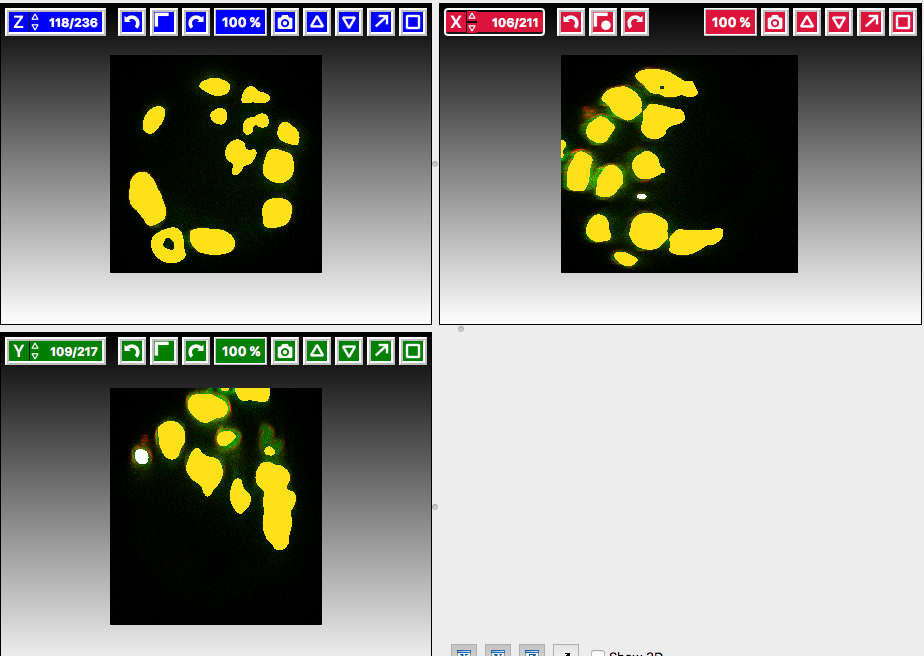
Click on
Object information exportharmonica.Changing the
Sourcedropdown menu, export sequentiallyObject PredictionsandObject Probabilities.Click on
Configure Feature Table Exportbutton in the left-hand pane and configure the location of the exported Also, changing the export format of the table in theFormatdropdown menu, export sequentially the table as HDF as well as CSV format.
In the
Featuresharmonica, click theAllbutton to export all features.Click
OK.Back in the main ilastik interface, click
Export All(repeat as necessary to export all formats of the images and the two formats of the export table).Save the Project.
Import the CSV to OMERO, as well as the Probabilities.
Make an OMERO.table out of the CSV and attach it on the Project in OMERO. This can be done using omero-metadata plugin or from scratch using the extended groovy script from Fiji.