Work with ROIs in OMERO.iviewer
In this section, we cover the ability of OMERO.iviewer to work with ROIs, to draw, edit, annotate and evaluate ROIs in the images is shown. In this way, a simple image analysis can be achieved, such as getting the intensity measurements inside the pixels of the ROIs and sizes of the ROIs, such as areas for polygons and lengths for lines and polylines.
Description
We will show:
- How to inspect the intensities
- How to draw ROIs on the image
- How to view ROIs associated with different z or t planes
- How to use the
Planestab in OMERO.iviewer to see the spread of ROIs in multi-z, t images - How to create comments on ROIs and enable and disable the ROI popups
- How to produce simple analysis results from the ROIs and and export the results locally
Resources
New features video (ROI popups, ROIs on multi-z or multi-t images)
Example files used
Note: Only some of the images in this dataset are z-stacks, for example
Setup
OMERO.iviewer installation
OMERO.iviewer is a pip installable application for OMERO.web. Follow the steps described in https://pypi.org/project/omero-iviewer/ to install it and configure the OMERO.web accordingly.
The walkthrough assumes that OMERO.iviewer has been set up as the default viewer for OMERO.web.
Step-by-Step
Double-click on an Image thumbnail, or click the
Full Viewer button in the right-hand pane to open an Image in a larger viewer called OMERO.iviewer. It is a Web app developed and released independently from the webclient. The OMERO.web framework can be extended with multiple apps to view data in different ways.
Click the
Crosshairsicon at the top-right of the viewer to enable the pixel intensity display for the mouse pointer. Then mouse over the Image to see the pixel intensities for the channels turned on.
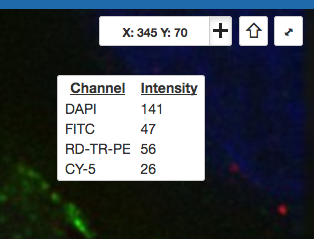
The
ROIstab includes tools for viewing and drawing ROIs on the Image. These are saved back to the OMERO server. Select the
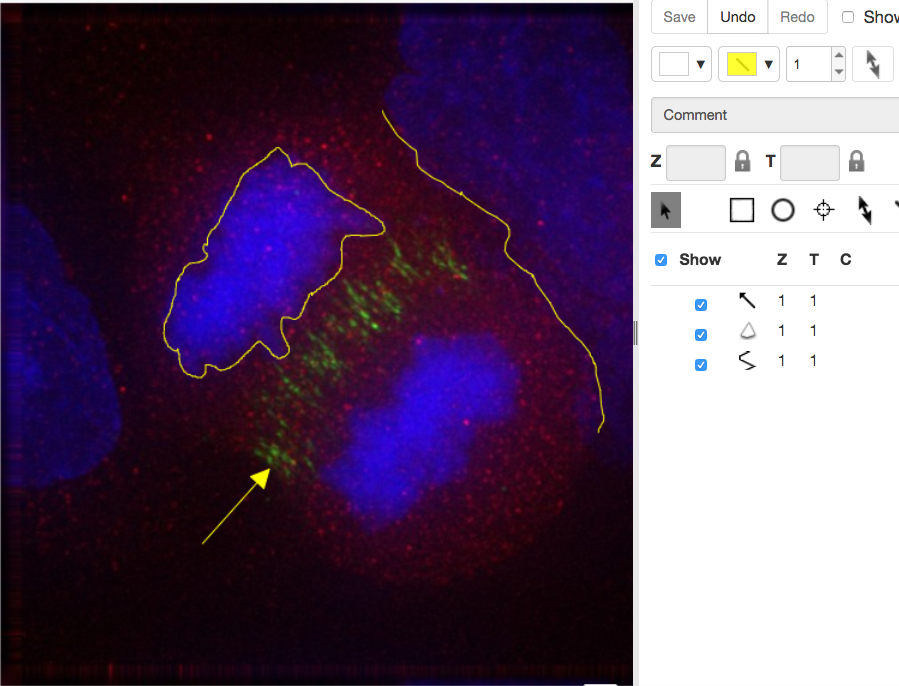
 arrow toolin the right-hand pane and draw an arrow on the Image, using Click-Move-Click (not drag), pointing to a feature in the Image and save it using the
 Savebutton located in the upper part of the right-hand pane. Draw also a couple of other ROIs on different Z planes.- Dragging on the Image is used for panning the image.
- Shift-drag rotates the image (using selection tool) or draws
freehand(polygon, polyline, rectangle and ellipse).
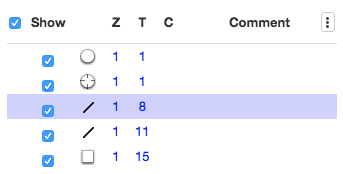
Clicking onto the ROIs in the right-hand pane table brings the viewport to the position where the selected ROI is in the middle of it and navigates the viewport to the timepoint the ROI is associated with.
Select the
Planestab above the ROI table.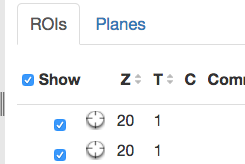
The
Planestab gives you an overview of the ROIs distribution over the z or t sections. The boxes in the schema in thePlanestab represent single z or t planes and are selectable.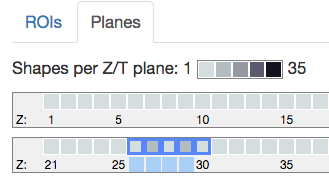
You can select one box, this will navigate to the corresponding plane in the image viewer. Alternatively, select a range of boxes, which will display a projection of the range of the selected planes (in case of multi-z image) in the main viewer.
Click onto a ROI in the image. A popup will appear. You can write a comment to this ROI directly into the popup.
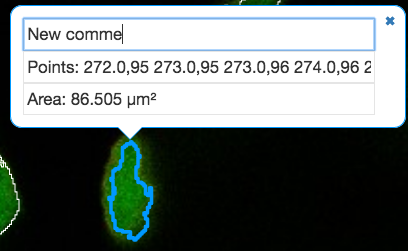
The popups can be disabled for all ROIs on the image by clicking onto the cross of one popup and closing it, and re-enabled by using a context menu accessed by right-clicking onto the image.
You can copy the values in the popup such as area (select and
Ctrl + C) and paste them into your local documents.Select several ROIs from different z planes. You can select in the table (
Shift+clickto select a range) but also in the image itself usingCtrl+drag(Cmd-dragon Mac) to select multiple ROIs.Export the Intensities, areas and line lengths into Excel. Select, in the top-left corner
ROIs > Export (Excel). This will export the values from the selected ROIs.Note: ROI intensities and coordinates from the whole image or dataset can be exported using the script
Batch ROI Export. Draw ROIs on the image as instructed above, go to OMERO.web and select the image or dataset in the left-hand side tree. Find the cog icon above central pane. Then, select theExport scripts > Batch ROI Exportand run the script.