Analyze metadata using OMERO.parade
Description:
OMERO.parade is a metadata-mining plugin for OMERO.web. It enables access to the metadata of images in OMERO for plotting, display and filtering of images. Supported metadata includes number of ROIs, Key-Value pairs, and data stored in OMERO.tables.
Setup:
- Install the OMERO.parade web app as described at https://pypi.org/project/omero-parade/
Resources:
- Sample images from the Image Data Resource (IDR) idr0021. See idr0021-data-prep.md for download and import instructions.
- Sample plate data from Plate with 422 on IDR from idr0002. Use the script idr_copy_plate.py to copy Plate ID 422. Run the script with
$ python idr_copy_plate.py username password 422 --server your.server.org
Step-by-Step:
Filter Images by Annotations and ROI Count
- Select the Project idr0021.
- Choose the Parade option in the centre panel dropdown menu.
- Expand all Datasets by clicking on the Open All button.
- All the Datasets will be expanded in the left-hand tree.
- The Thumbnails will be loaded in the centre panel. This allows to browse a full Project.
- Note that if you collapse a Dataset in the tree, the Thumbnails will be removed from the centre panel.
- In the Add filter… selection box, select the Key_Value item.
- When the Map Annotations are loaded, pick the Key Gene Symbol and enter the Value CEP to show all CEP genes and then CEP120 to show only images with that gene.
- To remove this last filter, hover over the filter and click the X button that shows on hover.
- In the Add filter… selection box, select the ROI_Count item.
- Enter a Value > 20. When you hover over the area used to enter the value, the range is indicated in the tooltip.
- Then enter < 3 or 4.
- Remove all filters by clicking the X button showing on hover.
- Select several images in the Dataset, and in the right-hand pane add
a comment to them saying “poor staining”. Refresh, using the
refresh button
 above the left-hand pane.
 - In the Add filer… selection box, select the Comment item.
- Enter a text “poor staining”
- Note that you can use the selected images in right panel to annotate or Open with….
- For example, Open with Figure…
Analyze OMERO.table data using OMERO.parade
In case the parameter values on the images are coming from OMERO.tables (stored in OMERO.tables as numerical values), OMERO.parade also enables to compare parameters in metadata, using heatmaps ordering and plotting of the parameters against each other.
For how to create an OMERO.table from a csv file see https://github.com/ome/omero-metadata/blob/master/README.rst
For how to create an OMERO.table using a script, see workflow (link to Fiji workflow).
Select the Project idr0021.
Choose the Parade option in the centre panel dropdown menu.
Expand all Datasets by clicking on the Open All button.
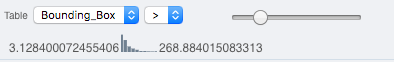
In the Add filter… selection box, select the Table item so we can find using the analytical results generated previously:. Choose the Bounding_Box item and drag the slider to filter the Images. Note that PCNT has the largest number of Images with large ROIs.
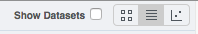
Switch to Table layout (middle button).

In the selection box Add table data…, select
- Table_Bounding_Box
- Table_Total_Area
- Table_Image
- Note that it is currently not possible to remove a column.
Click on the name of a column to sort it.
Uncheck Show Datasets to sort all Images together e.g. by ROI count.
Check the checkbox in each column to show the Heatmap. Note the corresponding pattern in the Heatmap.
Switch now to the Plot Layout (third button).
It takes the first 2 columns of table data loaded and plots the values.
Filters can be added to plot the relevant results.
Try plotting by different Axis values.
Closing a Dataset in the left-hand tree removes the values from the plot.
Drag to select several outliers.
Note that you can use the selected images in right panel to annotate or Open with….
For example, Open with Figure…
Filter Plate Wells using OMERO.table data
Let’s now look at the results generated by CellProfiler
Return to the webclient and select the Plate named plate1_1_013.
Select a Well and open the Tables pane in the General tab in the right-hand panel. This will show all the CellProfiler values for this Well.
In the Thumbnails chooser at the top-right of the centre panel, select the Parade plugin.
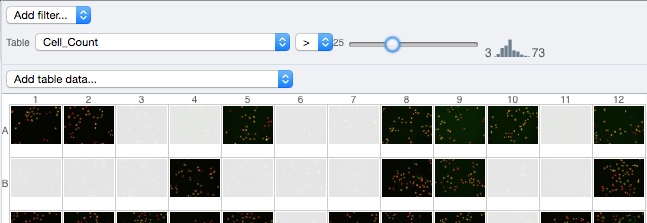
At the top-left of the centre panel choose Add filter… -> Table to filter Wells by the data from CellProfiler.
Change the filter from ImageNumber to Cell_Count (at the bottom of the list).
Now you can use a slider to filter Wells by Cell Count.