OMERO.figure scripting
Description:
We can use JavaScript in the browser console to script changes to a figure. This is an experimental feature and not documented. In this example, we will automatically add labels based on analysis results.
Setup:
- Install the OMERO.figure web app as described at https://pypi.org/project/omero-figure/
- Upload the script
Split_View_Figure.pyto the OMERO scripting service
Resources:
- Any multi-channel images, such as https://downloads.openmicroscopy.org/images/DV/siRNAi-HeLa/
- Any time-lapse images, such as https://downloads.openmicroscopy.org/images/DV/will/FRAP/
Step-by-Step:
Figure creation in Python
OMERO.figure files are simply JSON data, stored in OMERO File Annotations with a specific namespace of omero.web.figure.json. We can create these files using Python scripts, uploaded to the OMERO.scripting service to make them available to all OMERO users.
The format of the JSON is described at https://github.com/ome/omero-figure/blob/master/docs/figure_file_format.rst.
We will use the example Split_View_Figure.py script.
- Select a few images in the webclient.
- Click on the Script button
 in the top-right of the webclient and choose the
Split_View_Figure.pyscript (e.g. under Workshop Scripts). - Run the script. When complete, open the OMERO.figure app and File > Open.
- Choose the most recent figure, called “Split View Figure”.
Figure editing in JavaScript
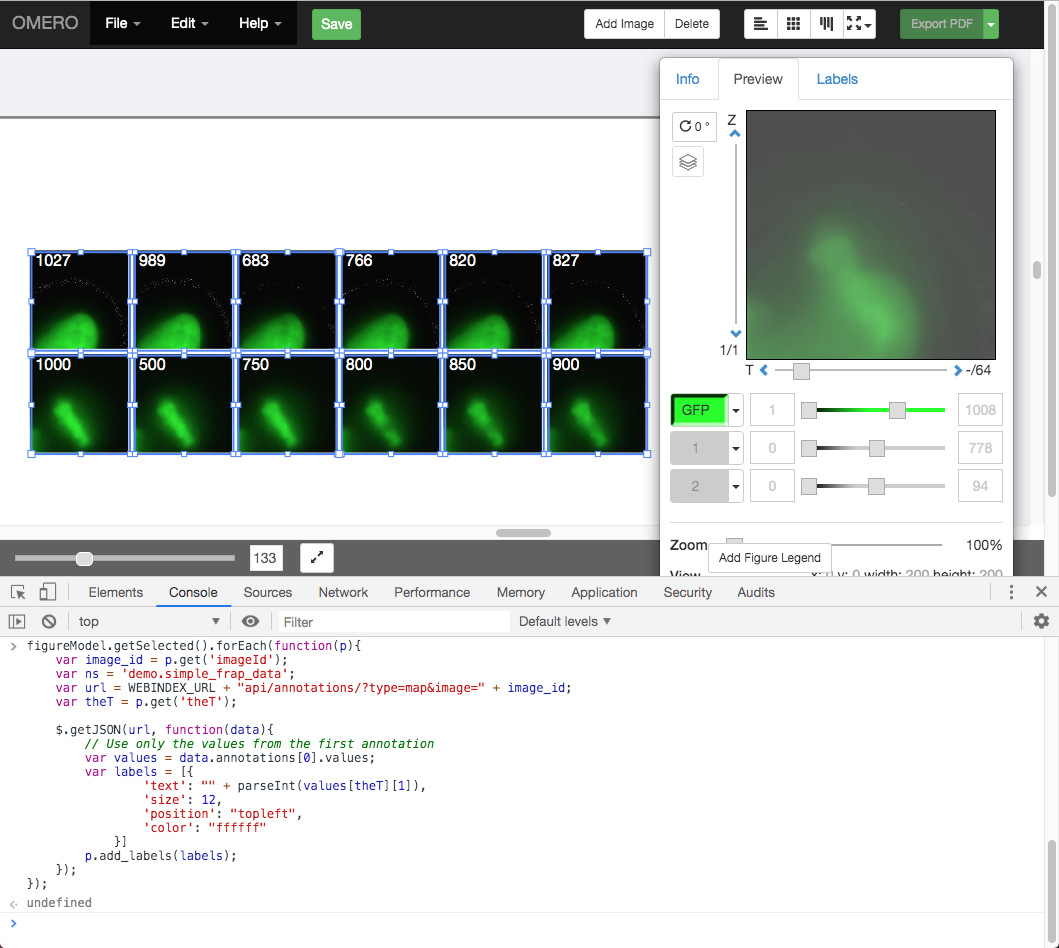
We will use the time-lapse images listed above to create a FRAP figure but you can use any time-lapse images.
To see the data model for any current file in OMERO.figure, go to File > Export as JSON….
You will see that the
panelslist defines the panels and each panel has attributes. For example, a panel with a single white label might include the following attributes:"name": "image1.tiff", "labels":[{"text":"label text","size":12,"position":"topleft","color":"FFFFFF"}], "x": 200, "y", 200, "width": 100, "height": 100, ...many other attributes not shown...
The
figureModelvariable is accessible in the console. We can usefigureModel.getSelected()to get selected panels and for each panel we can callp.set()to change an attribute.For example, to set the
heightof each selected panel to200, we can do:figureModel.getSelected().forEach(function(p){ p.set('height', 200) });
We can use AJAX to load JSON data and we will use
p.add_labels()to create labels.In this example we will load the FRAP intensities from the Map Annotations on these images.
Select 2 FRAP images that have previously been analysed to create a
Map Annotationwith the namespacedemo.simple_frap_data.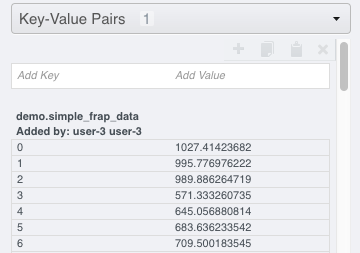
Alternatively, you can add your own
Map Annotationwith each Key being a T-index (start at 0), and the Value will be a FRAP intensity (number).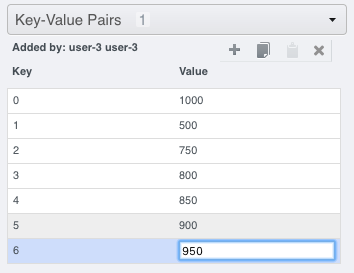
Create a Figure with 2 images.
Copy and paste each image several times and increment T-index in the Preview panel to show multiple time-points per image.
Open the browser console by right-click > Inspect Element (Firefox) or right-click > Inspect (Chrome) and click on the Console tab.
Copy the code from https://raw.githubusercontent.com/ome/training-scripts/v0.6.0/practical/javascript/figure_frap_mapannotation_label.js
Drag to select the FRAP movie images in the figure.
Paste the code into the console. Do not hit enter yet.
Inspect the code. It will iterate through each of the selected panels, an AJAX call is made to load the Map Annotations with the namespace that we created from FRAP values above.
NB: If you manually created your own Map Annotation above, you can remove the line
url += '&ns=' + ns;to avoid filtering by namespace.The FRAP values are a list of
[key, value]pairs and we can get the value for the current T index of the panel withvalues[theT][1]and use this to create a label.Hit Enter to run the code on selected panels.
The labels should be added. Note that you can undo and redo these changes in the UI as normal.
Try out other examples in https://github.com/ome/training-scripts/tree/v0.6.0/practical/javascript