OMERO.figure scripting
Description
We can use Python scripts on the OMERO.server or JavaScript in the browser Console to create or modify OMERO.figures. These are experimental features and not documented elsewhere.
Setup
Install the OMERO.figure web app as described at https://pypi.org/project/omero-figure/
Upload the script
Split_View_Figure.pyto the OMERO scripting serviceFor the Shapes heatmap from OMERO.table example, you’ll need to draw ROIs on an Image and create an OMERO.table on the Image with a
Shapecolumn as described in the example.
Resources
For Figure creation in Python, any multi-channel images, e.g. from siRNAi-HeLa
For the Labels from Map Annotations example, any time-lapse images, e.g. FRAP.
For the other sections, any images can be used.
Figure creation in Python
OMERO.figure files are simply JSON data, stored in OMERO File Annotations with a specific
namespace of omero.web.figure.json. We can create these files using Python scripts, uploaded to
the OMERO.scripting service to make them available to all OMERO users.
The format of the JSON is described in the Format page. We will use the example Split_View_Figure.py script.
Select a few multi-channel Images in the webclient.
Click on the Script button
 in the top-right of the webclient and choose the
Split_View_Figure.pyscript (e.g. under Workshop Scripts).Choose a value for Row Labels input. The default is label each row with the Image Name, but you can also choose Tags as in the example below.
Run the script. When complete, open the OMERO.figure app and File > Open.
Choose the most recent figure, called “Split View Figure”.
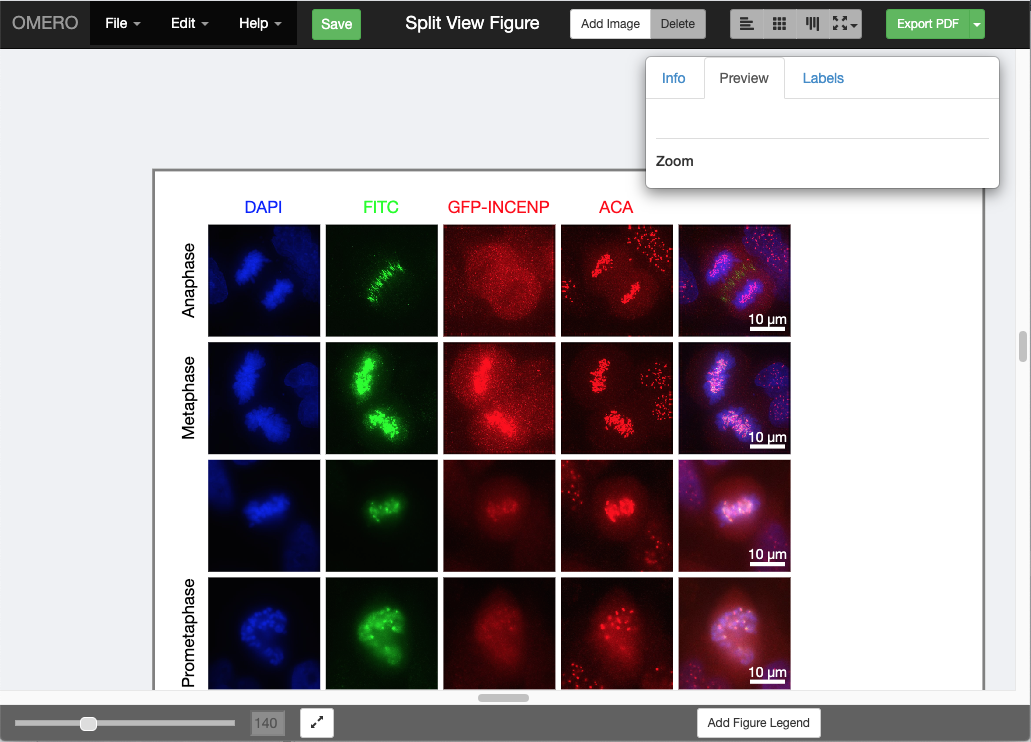
Figure editing in JavaScript
To see the data model for any current file in OMERO.figure, go to File > Export as JSON….
You will see that the
panelslist defines the panels and each panel has attributes. For example, a panel with a single white label might include the following attributes:"name": "image1.tiff", "labels":[{"text":"label text","size":12,"position":"topleft","color":"FFFFFF"}], "x": 200, "y", 200, "width": 100, "height": 100, ...many other attributes not shown...
The
figureModelvariable is accessible in the Console of the browser Developer Tools. The easiest way to open the developer tools in most browsers is to open the context menu (right-click) anywhere on the page and choose Inspect.We can use
figureModel.getSelected()to get selected panels and for each panel we can callp.set()to change an attribute.For example, to set the
heightof several panels to200, we can select the panels in the figure UI and paste this code snippet in the Console:figureModel.getSelected().forEach(function(p){ p.set('height', 200) });
There are several JavaScript examples in the scripts folder. Many of these are quite simple and self-explanatory. Below are some more complex examples that require specific set-up steps.
Example 1: Labels from Map Annotations
We will use the time-lapse images listed above to create a FRAP figure but you can use any time-lapse images.
We can use AJAX to load JSON data and we will use
p.add_labels()to create labels.In this example we will load the FRAP intensities from the Map Annotations on these images.
Select 2 FRAP images that have previously been analysed to create a
Map Annotationwith the namespacedemo.simple_frap_data.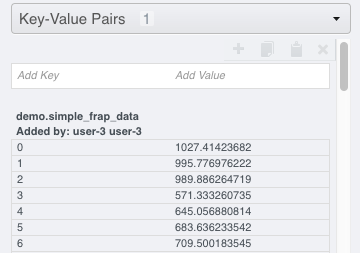
Alternatively, you can add your own
Map Annotationwith each Key being a T-index (start at 0), and the Value will be a FRAP intensity (number).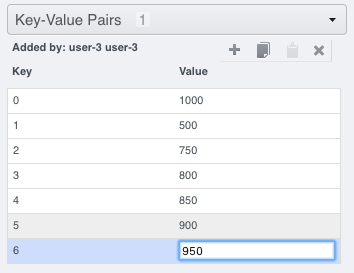
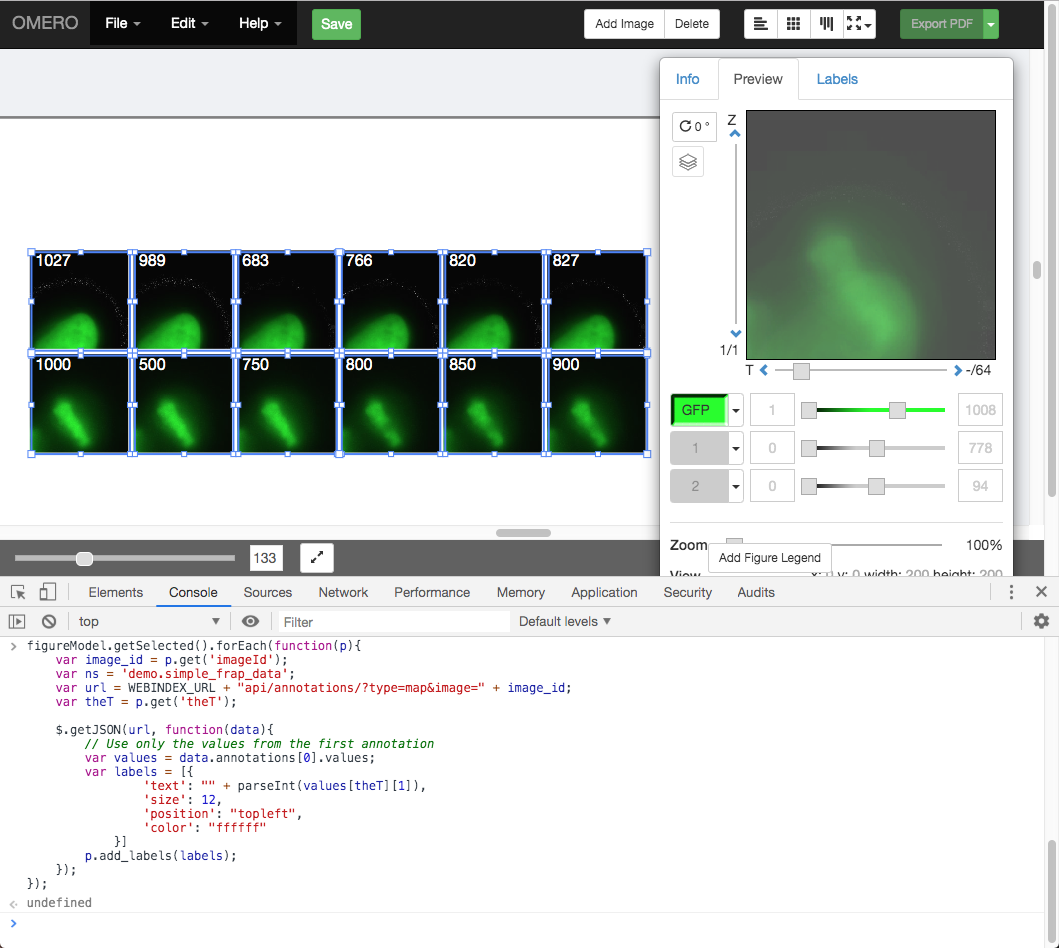
Create a Figure with 2 images.
Copy and paste each image several times and increment T-index in the Preview panel to show multiple time-points per image.
Open the browser console by right-click > Inspect Element (Firefox) or right-click > Inspect (Chrome) and click on the Console tab.
Copy the code from figure_frap_mapannotation_label.js <https://github.com/ome/omero-guide-figure/tree/master/scripts/figure_frap_mapannotation_label.js>.
Drag to select the FRAP movie images in the figure.
Paste the code into the console. Do not hit enter yet.
Inspect the code. It will iterate through each of the selected panels, an AJAX call is made to load the Map Annotations with the namespace that we created from FRAP values above.
NB: If you manually created your own Map Annotation above, you can remove the line
url += '&ns=' + ns;to avoid filtering by namespace.The FRAP values are a list of
[key, value]pairs and we can get the value for the current T index of the panel withvalues[theT][1]and use this to create a label.Hit Enter to run the code on selected panels.
The labels should be added. Note that you can undo and redo these changes in the UI as normal.
Example 2: Shapes heatmap from OMERO.table
This example uses an OMERO.table linked to each Image to generate a heatmap of colors applied to Shapes on the figure panel.
Setup:
If you wish to use Images and table data from idr0079, see the setup steps at idr0079-data-prep.
Alternatively, perform the following steps:
For the Image you wish to use, add some ROIs to the Image. You can see the ROI and Shape IDs in the iviewer ROI table.
To setup the OMERO.table, create a CSV file with an
Roicolumn and aShapecolumn containing the corresponding IDs and 1 or more number columns. The#headerdefines the column types:l(long) for integers andd(double) for floats. For example:# header roi,l,d,d,l Roi,Shape,Area,Sphericity,Pixels 1,10,34.5,0.5,110 2,11,18.2,0.6,55 2,12,44.1,0.9,210
Save the edited csv as
data.csv.With
omero-metadatainstalled on the command-line, we can create an OMERO.table on the Image, using the Image ID:$ omero metadata populate Image:123 --file data.csv
OMERO.figure steps:
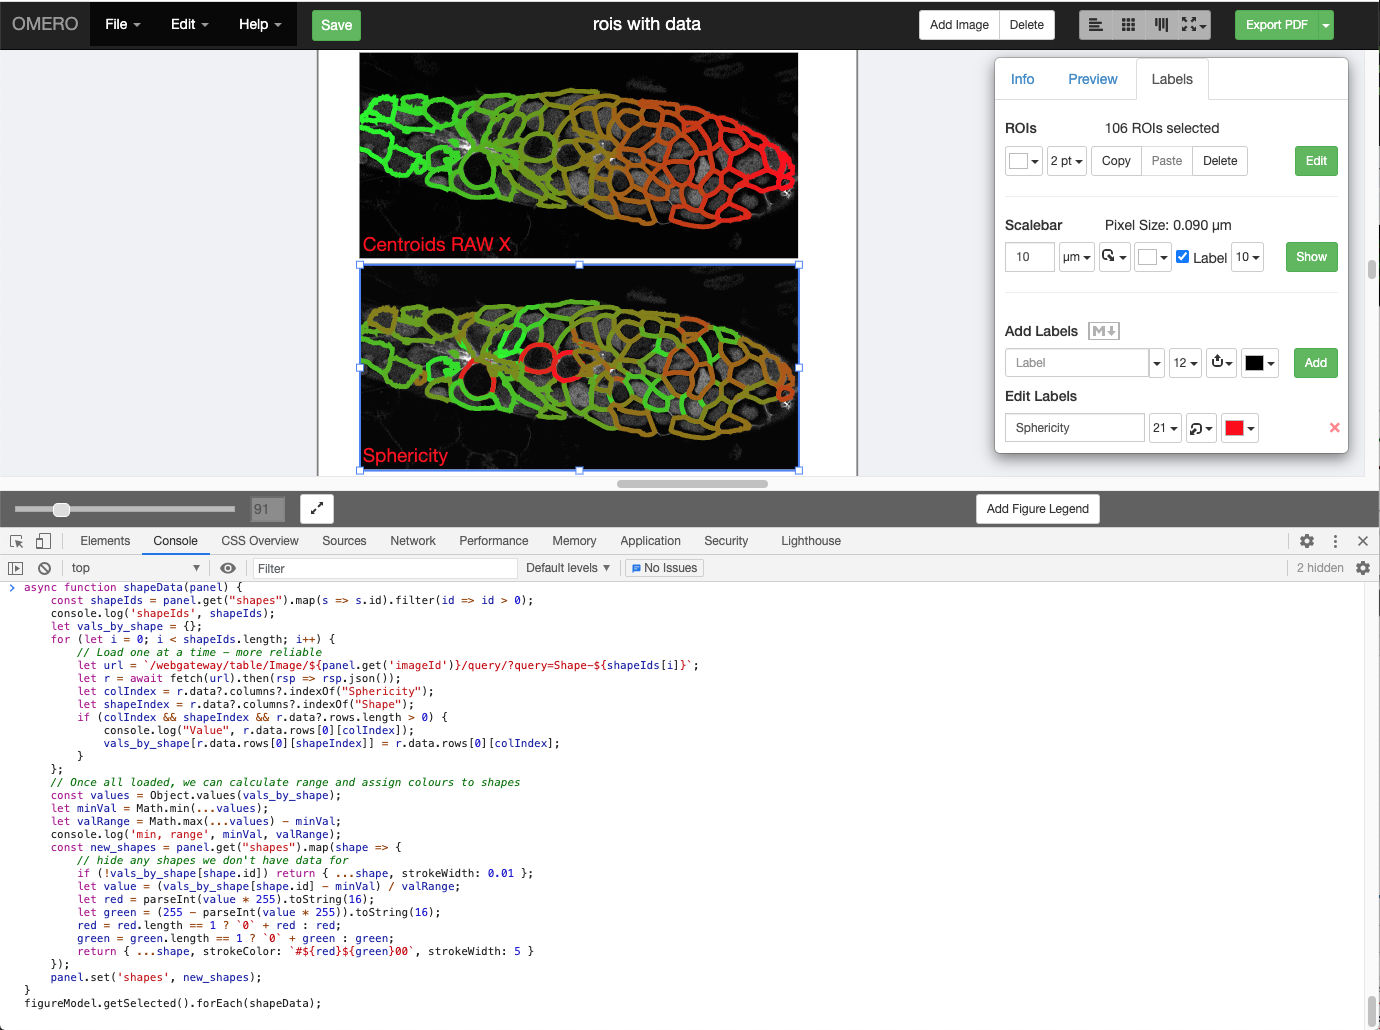
In OMERO.figure, add the Image to the figure, then in the ROIs dialog, load the Shapes from OMERO and add them to the panel. The JSON data for each Shape will have an
idthat corresponds to the Shape in OMERO.View the JavaScript snippet at figure_table_data_shapes.js. This uses the ID of each Shape of the panel to query the most recent OMERO.table on the Image using the endpoint:
/webgateway/table/Image/{imageId}/query/?query=Shape-{shapeId}, which returns all table rows for that Shape ID. From the JSON returned, we find the column index for the data we want, e.g.Sphericity, and then get the value for that column. Once the values for all Shapes on the panel are loaded, the code calculates the range and generates a heatmap color for each value in that range. This is set as the color on each Shape.Select the panel in the figure, then paste the JavaScript code into the browser Console and hit Enter
In the screenshot below, Shapes in the first panel are colored according to the
Centroids_RAW_Xcolumn and Shapes on the lower panel are colored according to theSphericitycolumn. Images in this example are from idr0079.