Create figures using OMERO.figure
OMERO.figure is a web-based tool for creating figures from Images in OMERO. Image metadata can be used to facilitate figure creation.
Description
This guide covers:
Opening images in OMERO.figure to create a new figure
How to add additional images to an existing figure
Arranging panels in the desired figure layout
How to synchronize the rendering settings between panels
How to add scalebars, labels and ROIs to panels
How to save and export figures as PDF or TIFF
Setup
Install the OMERO.figure web app as described at https://pypi.org/project/omero-figure/
Resources
Sample images from the Image Data Resource (IDR) idr0021. See idr0021-data-prep.md for download and import instructions.
DV images from siRNAi-HeLa.
SVS ‘big’ pathology images from SVS.
Step-by-Step
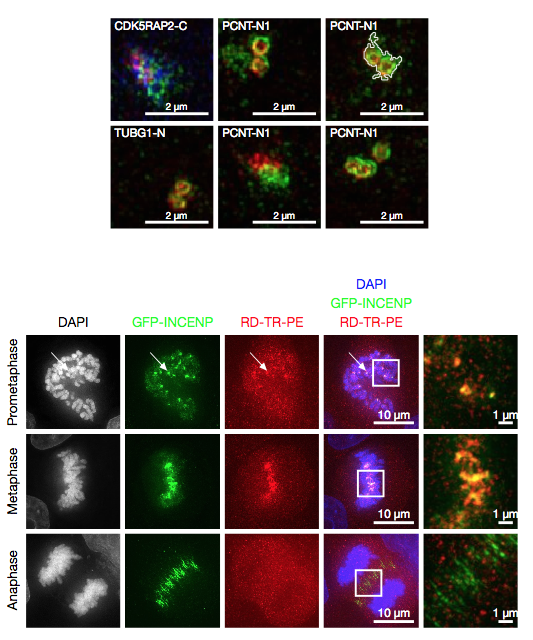
Using the sample images above, we will create a figure like this, but you can use any multi-channel images.
In the webclient, select 6 images from the idr0021 Project.
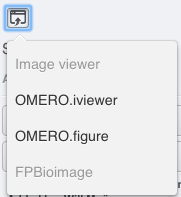
In the right-hand panel, click the Open with… button and choose OMERO.figure:
This will open these images in OMERO.figure in a new browser tab.
Drag to arrange the Images approximately into two rows, select all (use Ctrl-A or drag to select) and click the snap to grid button
 at the top of the page.
Select all Images and Zoom in around ~300%, using the Zoom slider in the right Preview tab.
Go to the Labels tab, select all Images and add a Scalebar: Click the Show button, choose a length of 2 μm, click the Label checkbox and adjust the size of the Label to 12.
Add labels: choose Dataset Name in the label input dropdown list, choose color white and position=top-left.
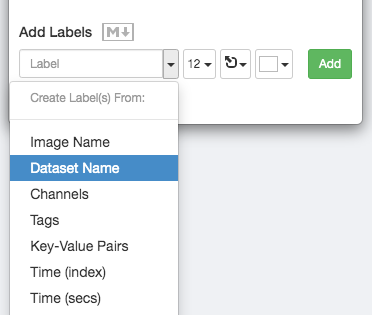
Click Add to create the new label.
Add labels: choose Key-Value Pairs in the label input dropdown list, and in the following popup choose the Key which you want to add the value of from the dropdown menu.
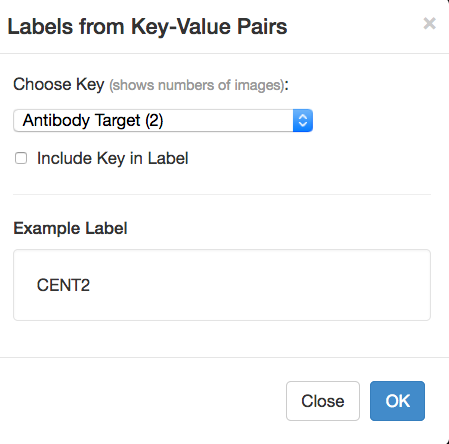
Click OK in that dialog to create the new label.
Select one image. In the Labels tab, click the Edit button for ROIs.
If the image has ROIs in OMERO, click Load ROIs.
Mouse over the list to show each ROI on the Image and click to add it to the Image.
Click OK to close the dialog.
Return to the webclient tab, select the siRNAi-HeLa Dataset. N.B.: You may wish to filter the images when selecting those to add to your figure, e.g. Filter by Rating.
Select 3 images and in the right-hand panel click the link icon
 then copy the link.
Return to the OMERO.figure tab, click Add Image button and paste the link into dialog. Click OK.
Arrange the 3 images into a vertical column, select all and click snap to grid button.
Copy the 3 images and paste (keyboard shortcut or Edit > Copy/Paste) 3 times to create 3 more columns.
Select the panels in the first column and adjust the rendering settings: Turn only the first channel on and set the color to white.
Repeat for the next 2 columns: 1 channel turned on for each column, adjusting the levels if desired, leaving the 4th column as merged with multiple channels on.
Select all panels and zoom a little. Then select all the panels from one row and drag the image in the Preview tab to pan the selected images to the same point.
Copy and paste the merged column again to create a 5th column. Zoom in to approx 500%.
Select the Labels tab, select the merged and zoomed columns and click Show Scalebar button.
Click the Label checkbox to add a label to the scalebar. Select only the zoomed-in panels and change the scalebar to 1 micron.
Select the top-left panel and enter a label text in the Add Labels form. “Prometaphase” in the example above.
Set the label size (14), position (left vertical) and color (black) and click Add to create a label.
If we have Tags on the images, we can use these to create labels:
Select the first column of panels and choose Tags from the label text-field drop-down options. Click Add.
Select the first row of panels and create the labels in the top position using the Channels option to add Labels for active channels in each image.
Edit the created labels located at the bottom of the Info tab to rename the green labels to GFP-INCENP.
Select just the first merged Image and click the ROIs Edit button in the Labels tab.
Draw arrows or other shapes on the Image, or load ROIs from OMERO. Click OK to close the dialog.
Click Copy ROIs in the Labels tab, select the other panels in the same row and click Paste to add ROIs to these panels.
To create a Rectangle ROI indicating the region of the zoomed-in image, select the zoomed-in image on the first row and click Copy of the cropped region at the bottom of the Preview tab.
Now select the zoomed-out ‘merged’ panel, and paste this region as an ROI by clicking Paste under ROIs section of the Labels tab.
Repeat for other rows of the figure. At this point we have created the figure in the screenshot above.
Saving and exporting figures
Go to File > Paper Setup… and in the dialog that pops up choose Pages: 2. Click OK.
Finally return to the webclient, select ‘Big’ images from the svs Dataset, copy the link to them and paste it into the Add Image dialog in OMERO.figure.
Move the big images to the 2nd page.
In the header, click on the Save button to save the Figure as “Figure 1”.
The URL will update. You can bookmark this URL or share with collaborators to view your figure.
To open other saved files, go File > Open…
We can view figures from our collaborators here and filter by name or Owner.
Choose a figure to Open. For example the Aurora-B figure 2 from trainer-2.
Select a panel and click on the Webclient link in the Info tab to show the image in the webclient.
Back in OMERO.figure, go to File > Open… to choose the “Figure 1” file saved above.
Click on Export PDF to export it as PDF.
Download the PDF and open it. If opened in a suitable application e.g. Illustrator, the elements on the page will still be editable.